Using k-means algorithm to cluster data
This tutorial explores the use of k-means algorithm to cluster data. K-means clustering is a widely used in data clustering for unsupervised learning tasks. The algorithm uses features to divide data into K groups with the most close inherent relationship. These groups are found by minimizing the within-cluster sum-of-squares. This means that instead of having a target variable Y, the K-Means algorithm produces a specific classification, or cluster number, for each observation. This tutorial examines how to use:
- Load data from a dataset using
loadd - Visualize a 2D dataset to identify the number of clusters.
- Fit a k-means model to dataset using
kmeansFit. - Plot clustered data using
plotClasses. - Add centroids to the plotted data.
Load data
The data for this tutorial is stored in the file kmeans_data.csv. This tutorial uses loadd to load the dataset into GAUSS prior to fitting the model. The function loadd uses the GAUSS formula string format which allows for loading and transforming of data in a single line. Detailed information on using formula string is available in the formula string tutorials.
The formula string syntax in loadd uses two specifications:
- The dataset specification
- A formula which specifies how to load the data which is optional if the complete dataset is to be loaded.
new; cls; library gml; rndseed 234234; //Load hitters dataset x = loadd(getGAUSSHome $+ "pkgs/gml/examples/kmeans_data.csv");
Visualize the data
The kmeansFit function in GAUSS requires the number of clusters as a user input. Visualizing the data can be one helpful step towards choosing the correct number of clusters. Since we are looking for a quick visualization of the data for model setup, the plotScatter function can be used with default format settings:
//View plot to get idea of clusters plotScatter(x[.,1], x[.,2]);
The resulting plot shows three clear clusters and suggests that we should use k = 3 for fitting our k-means model.

Fitting the k-means model
The k-means model is fit using the GAUSS procedure kmeansFit. The kmeansFits procedure takes two required inputs, a feature matrix and the number of clusters. In addition, the kmeansControl structure may be optionally included to specify model parameters.
The kmeansFit returns all output to a kmeansModel structure. An instance of the kmeansModel structure must be declared prior to calling kmeansFit. Each instance of the kmeansModel structure contains the following members:
| Member | Description |
|---|---|
| centroids | kxP matrix, containing the centroids with the lowest intra-cluster sum of squares. |
| assignments | Nx1 matrix, containing the centroid assignment for the corresponding observation of the input matrix. |
| totalSS | Scalar, sum, over all observations, of the squared differences of each observation from the overall mean. |
| clusterSS | Scalar, sum of squared differences between each observation and its assigned centroid. |
| elapsedIters | Scalar, the number of iterations taken by the 'start' with the lowest 'clusterSS'. |
The code below uses the k-means model to fit clusters to the data matrix, x :
//Step One declare kmeansModel struct struct kmeansModel mdl; //Step Two: Fit kmeans model mdl = kmeansFit(x , n_clusters);
Plotting the assigned classes
The GAUSS plotClasses function provides a convenient tool for plotting the assigned clusters. The plotClasses function produces a 2-D scatter plot of the data matrix with each class plotted in a different color. The procedure requires two inputs, a 2-dimensional data vector, x, and a vector of class labels, labels. The label vector may be either a string array or numeric vector. Finally, the plot can be formatted by including an optional plotControl structure.
To start, let's set-up the plotControl to add a title to our graph and to turn the grid on the plot off. This is done in four steps:
- Declare an instance of the
plotControlstructure. - Fill the structure with the defaults settings for a scatter plot using
plotGetDefaults - Use
plotSetTitleto specify, the wording, font, and font color for the graph title. - Use
plotSetGridto turn grid off.
//Declare plotControl structure struct plotControl myPlot; myPlot = plotGetDefaults("scatter"); //Set up title plotSetTitle(&myPlot, "K-mean Clustering", "Arial", 16, "Black"); //Turn grid off plotSetGrid(&myPlot, "off");
Next, we will plot the class assignments found using kmeansFit. These are stored in the kmeansModel member mdl.assignments:
//Step Four: Plot results plotClasses(x, mdl.assignments, myPlot );
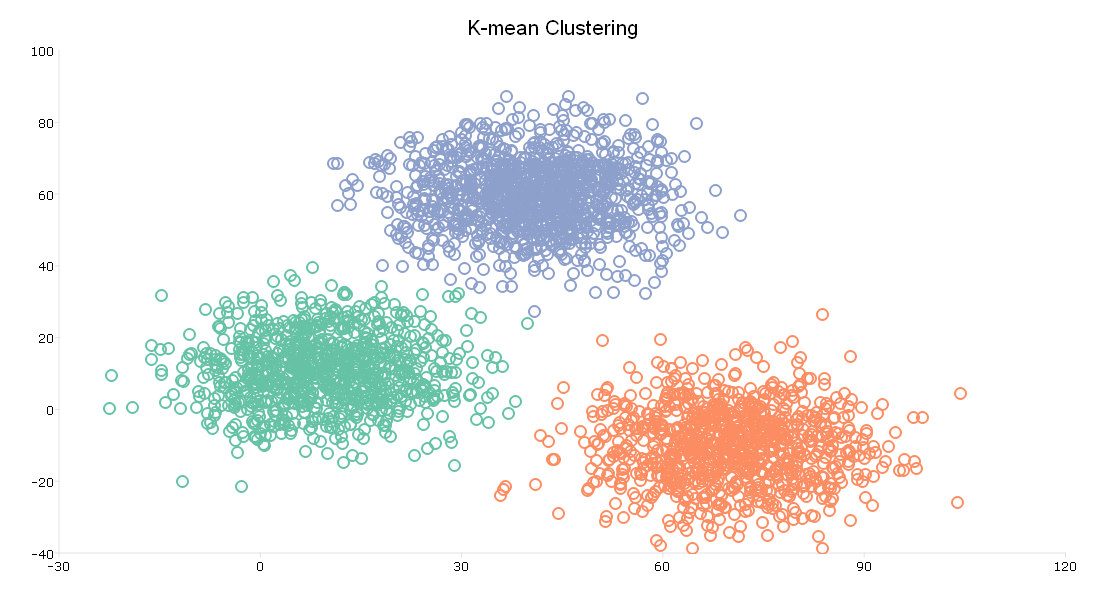
The plot shows the same scatter point as our initial plot of the data. However, the plot now shows three clusters, plotted in red, green, and blue.
Adding centroids
This graph is helpful but we may also be interested in seeing the centroids used to determine the clusters. To do this we will write our own procedure built around the GAUSS plotAddScatter procedure. Our procedure will format and add the centroids. User defined procedures always start with proc(number returns) and end with endp. Any returns from procedure should be within the statement retp(returns):
proc(1) = myNewProc(inputs); ... ... retp(myOutput); endp;
Our plot will take two inputs, both centroid vectors:
proc(0) = plotAddCentroids(centroid1, centroid2); //Set up plot format struct plotControl myPlot2; myPlot2 = plotGetDefaults("scatter"); //Set fill on marker plotSetLineStyle(&myPlot2, 1); //Set market ot star plotSetLineSymbol(&myPlot2, 0); //Set marker color plotSetLineColor(&myPlot2, "black"); plotAddScatter(myPlot2, mdl.centroids[.,1], mdl.centroids[.,2]); endp;
Once we have written our procedure, the procedure can be called just the same as any internal GAUSS procedure:
//Add centroids plotAddCentroids(mdl.centroids[.,1], mdl.centroids[.,2]);
